My Database Rebooted Itself at 5 AM, and the API Hung for 30 Seconds

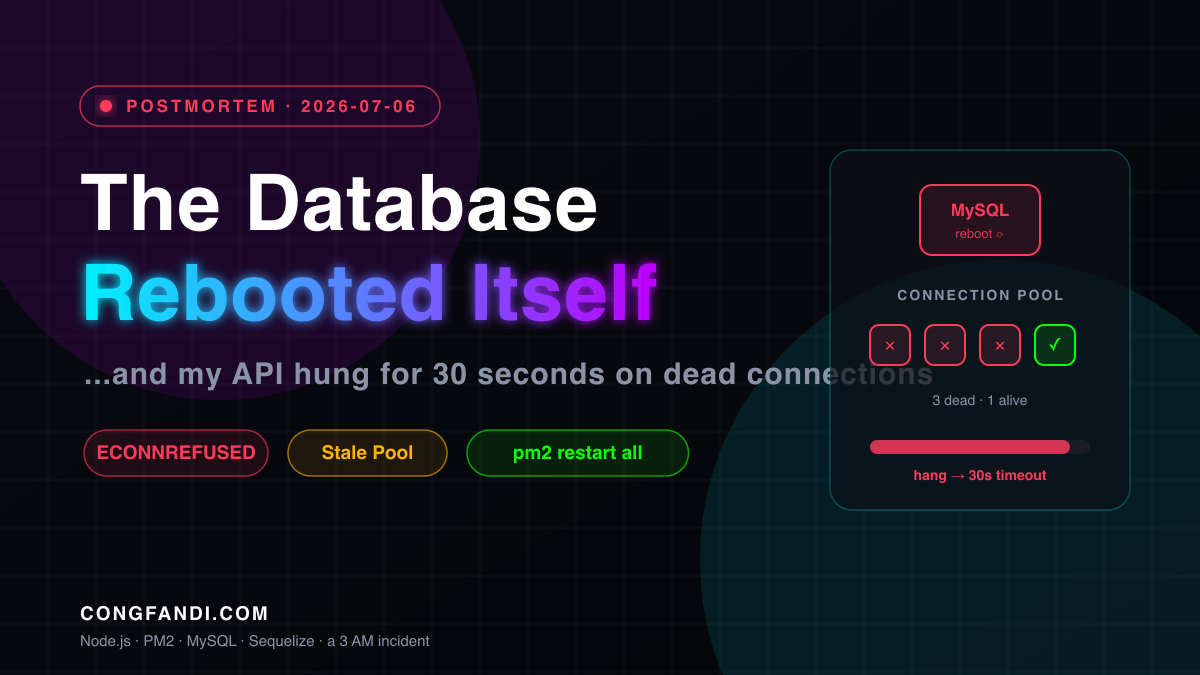
Around 5-something in the morning my phone was quiet. I was still fast asleep. What woke me up wasn't a pager — it was a user chat: "Hey, the home screen is super slow, it just spins and then freezes."
I opened the app. Yep. The home screen that normally loads in half a second was now frozen for a full 30 seconds before anything failed. Not a fast error that says "something's broken" — a silent freeze, like the app was thinking really hard but refusing to tell me about what.
Here's what nagged me: I hadn't deployed anything the night before. No code changed. The database was tiny too, just 1.4GB. So why was it suddenly on its deathbed?
Turns out the answer had nothing to do with my code, and nothing to do with the size of the database. This is the full debugging story, plus the playbook I wrote so I never panic if this comes back. 🕵️
First, Meet the Cast
Before the drama, here's the setup we're talking about. Nothing fancy:
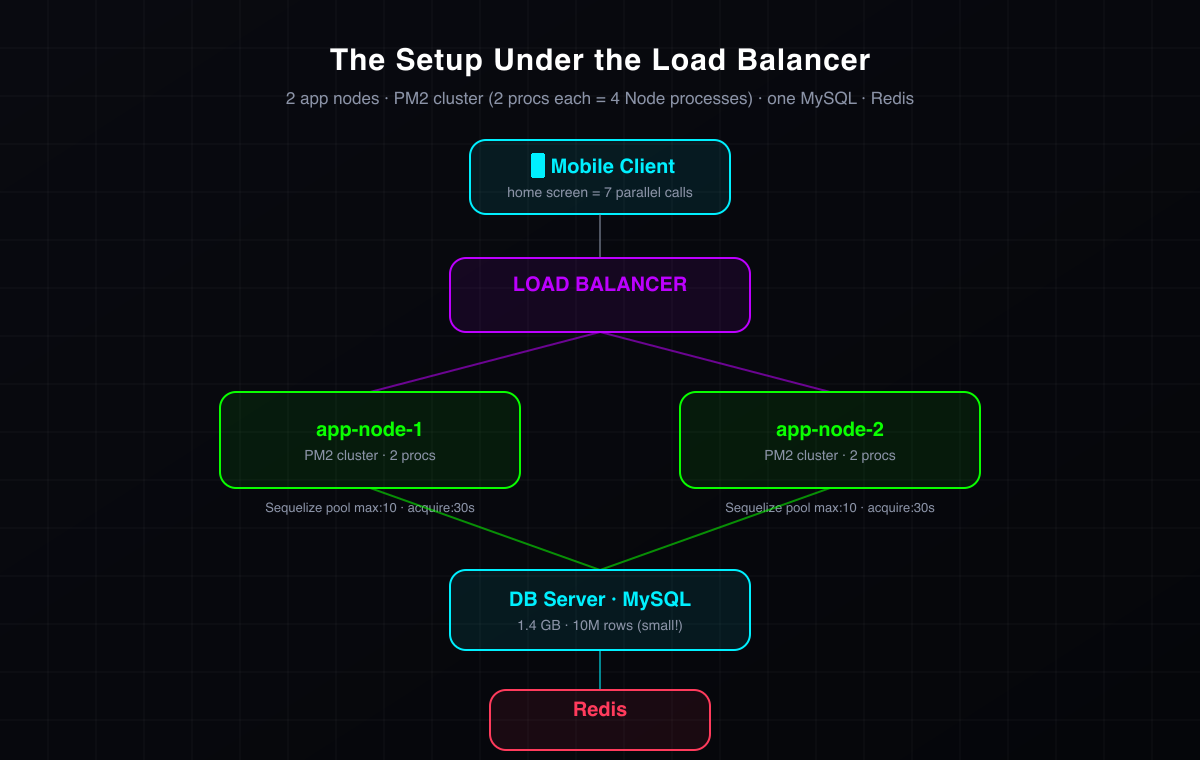
Read it top to bottom: the mobile app fires several endpoints at once to fill the home screen (seven parallel calls), hits a load balancer, gets spread across two app servers running Node.js under PM2 cluster (two processes per server, so four Node processes total), all talking to one MySQL, with Redis alongside for caching.
One number I want to nail down early: the database is small. 1.4GB, roughly 10 million rows. For MySQL that's nothing. So if anyone's tempted to say "your database is too big, switch to something else" — hold that thought, because that is not the problem. Not even close.
Debugging: Follow the Trail, Don't Guess
When an API gets slow, the biggest temptation is to guess. "Must be a heavy query!" "Must need Postgres!" "Must be an attack!" I forced myself not to guess and to follow the trail one step at a time.
Step 1 — Is Node itself alive?
Check whether the processes are healthy:
pm2 list
pm2 show <app-name>    # status, restarts, CPU, memory, event loop latency
pm2 monit              # live monitoring
The result was confusing and revealing at once: the app was online and relaxed. CPU at 1%, event loop at 0.5ms. That means Node wasn't struggling. It was waiting for something. When Node is idle but requests are slow, the bottleneck is outside Node — the database, Redis, or the network.
Step 2 — Which endpoint is slow?
Instead of guessing, I measured each endpoint with a curl loop that records timing:
TOKEN="<jwt-token>"
BASE="https://api.example.com"
for p in "/endpoint-a" "/endpoint-b" "/endpoint-c" "/endpoint-d" \
         "/endpoint-e" "/endpoint-f" "/endpoint-g"; do
  curl -s -o /dev/null \
    -w "%{http_code} ttfb=%{time_starttransfer} total=%{time_total}  $p\n" \
    --max-time 30 -H "Authorization: Bearer $TOKEN" "$BASE$p"
done
Here's what came out. Some endpoints were fast (~0.1s), others slammed into a full 30 seconds and died:
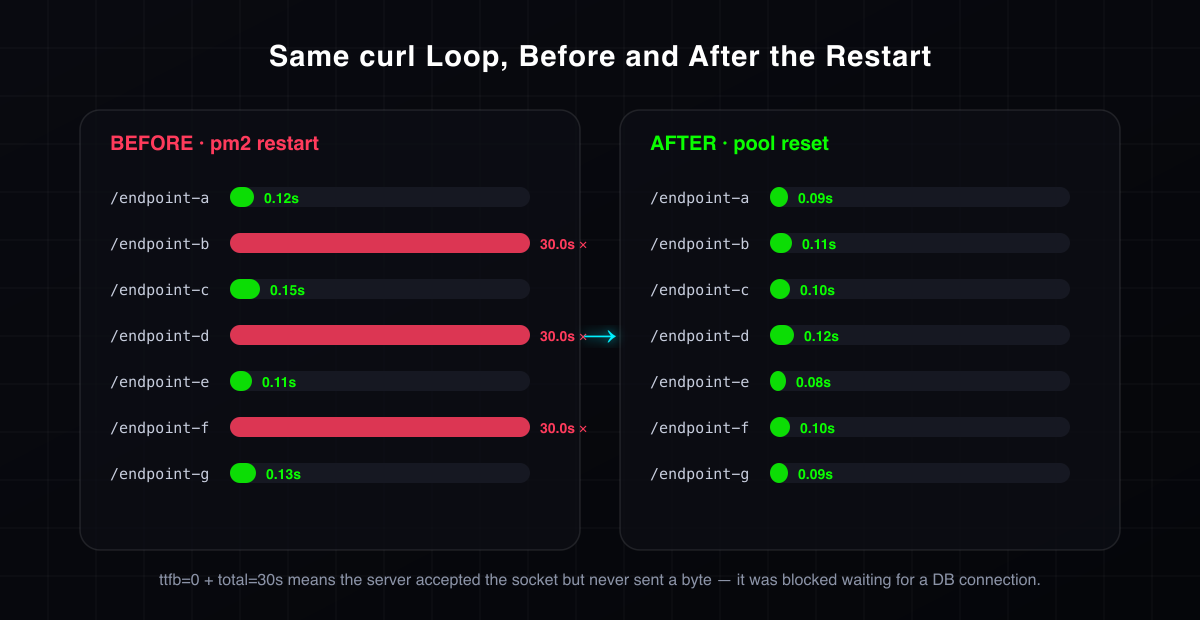
Look closely at the numbers. The stuck ones show ttfb=0 (time to first byte is zero) but total=30s. Translation: the server accepted the connection but never sent a single byte until it finally timed out. That's not "slow" — that's a hang. And that 30-second number isn't a coincidence, it's exactly the acquire: 30000 value in my pool config. A huge tell: the request couldn't get a database connection.
Step 3 — Read the error logs (this is where the root cause shows up)
pm2 logs <app-name> --err --lines 100 | grep -iE "acquire|timeout|connection|sequelize|econnrefused"
And there it was:
SequelizeConnectionRefusedError: connect ECONNREFUSED <DB_HOST>:3306
ECONNREFUSED. MySQL was refusing connections. Okay, so now I had a suspect. But it wasn't over — why was MySQL refusing? Was it down? Full? OOM-killed?
Step 4 — Inspect the database server
sudo systemctl status mysql       # up? just restarted? crash-looping?
sudo ss -tlnp | grep 3306         # listening on the right IP?
df -h ; df -i                     # disk full? (a common cause of MySQL dying)
free -h                           # OOM? check swap
sudo dmesg -T | grep -iE "oom|killed process|out of memory"
sudo tail -60 /var/log/mysql/error.log
Plot twist: when I checked, MySQL was perfectly healthy. Disk at 72%, plenty of free RAM, no trace of OOM, error log empty. MySQL didn't crash on its own. So why had it refused connections earlier?
Step 5 — Oh. The whole VM rebooted.
who -b                            # system boot time
last -x reboot shutdown | head    # reboot history
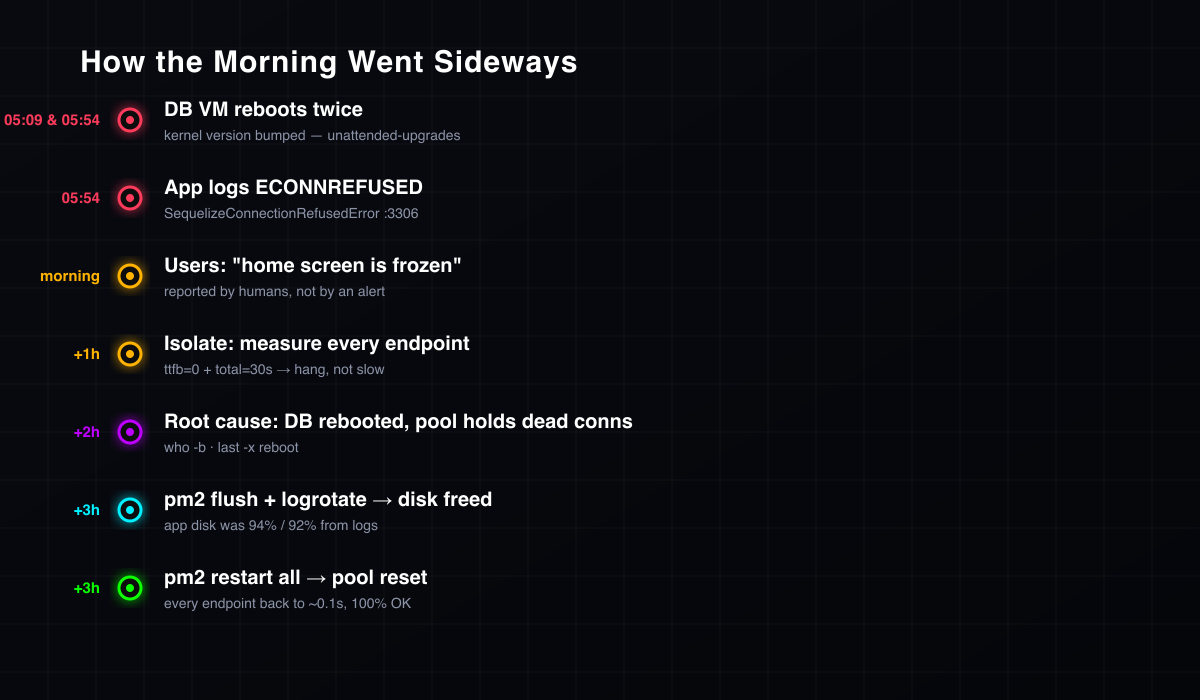
This was the key to the puzzle. The system boot time landed exactly at the incident hour. There were even two reboots back to back, and the kernel version had bumped. That means MySQL didn't crash — the VM rebooted, most likely because unattended-upgrades auto-rebooted after patching the kernel. MySQL just went down briefly while the machine restarted.
Here's the full timeline once the pieces clicked:
But Wait — If the DB Is Back, Why Is It Still Slow?
This is the most interesting part, and the biggest lesson of the whole incident.
The database was only down for a few seconds during the reboot. By the time I was debugging, MySQL had been healthy again for hours. Yet the API was still hanging. How can the DB be healthy and the app still stuck?
The answer: the connection pool in Node was holding dead connections.
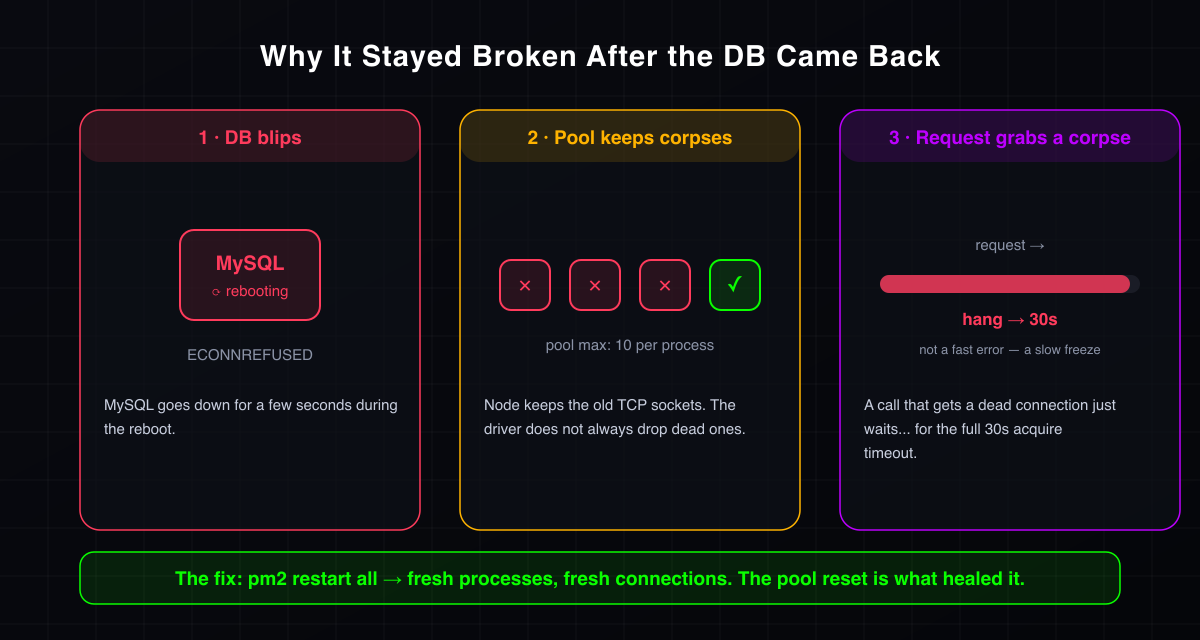
Here's the logic, three steps:
- The DB blips. When the VM reboots, MySQL goes down for a few seconds. Every open TCP connection to it is severed instantly.
- The pool keeps corpses. Sequelize (via the mysql2 driver) keeps a connection pool,
max: 10per process. The problem: the driver doesn't always drop broken connections automatically. So those dead sockets left over from the reboot are still sitting in the pool, looking "available." - A request grabs a corpse. When a request comes in and picks one of those dead connections, it doesn't error out immediately. It waits. Waiting on a connection that will never answer, right up to the
acquire: 30000limit — a full 30 seconds — before giving up.
So the user saw a 30-second frozen screen not because the DB was down, but because the app was politely waiting on a connection that had become a ghost.
And my config made it worse: ECONNREFUSED retry 3×, connectTimeout 15 seconds, acquire 30 seconds. All those "patient" numbers turned what should have been a fast failure into a long hang.
There Was a Bonus Problem: Nearly-Full Disk
While digging, I checked the app server disks too. It turned out:
df -h
du -sh ~/.pm2/logs
sudo du -xh / --max-depth=1 | sort -rh | head
The disks were at 94% and 92% — almost full. The culprit? PM2 logs that were never rotated. Piling up quietly for months. It wasn't the cause of that day's incident, but it was a time bomb waiting for its turn.
What Actually Fixed It
Once everything was clear, the fix was almost embarrassingly simple:
| # | Action | Result |
|---|---|---|
| 1 | pm2 flush on all app servers | Disk dropped hard (94% → 67%, freed ~6GB) |
| 2 | Install & configure pm2-logrotate (max 20M, retain 3, compress) | Logs won't balloon again |
| 3 | pm2 restart all | Connection pool reset → every endpoint normal |
| 4 | Re-verify with the curl loop | All 200; the ones that hung now succeed 100% at ~0.1s |
The key is step 3. Why did pm2 restart all work? A restart spins up brand-new Node processes with fresh database connections. All the corpse connections left over from the reboot get thrown out completely. So what actually healed it was the pool reset, not the DB being wrong, not my code being wrong.
Notice the distinction: I restarted the service (pm2), I didn't reboot the server. That matters.
The Playbook: If It Happens Again
So I never panic or guess again, I wrote this sequence down. Save it for the next slow-API / timeout incident:
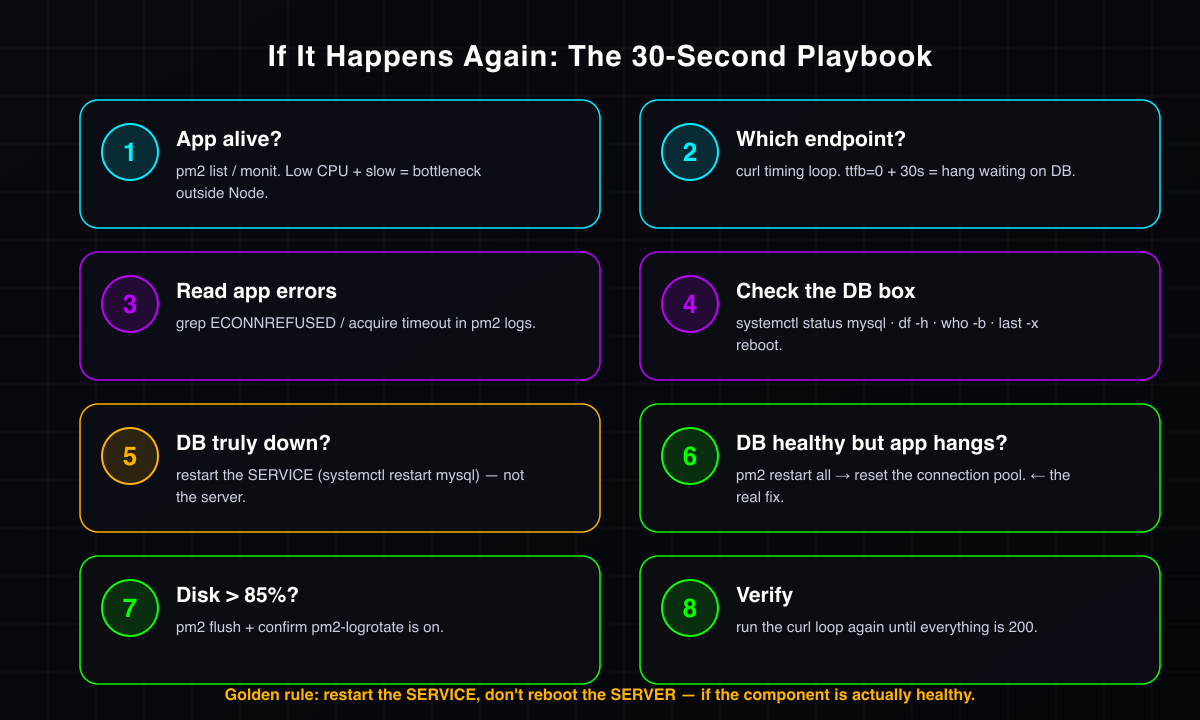
- Is the app alive? →
pm2 list/pm2 monit. Low CPU & event loop but slow requests = bottleneck outside Node. - Which endpoint is slow? → run the
curltiming loop.ttfb=0+ 30s = hanging while waiting on the DB. - Read the app errors → grep
ECONNREFUSED/acquire timeoutinpm2 logs. - Check the DB server →
systemctl status mysql,df -h,free -h,who -b,last -x reboot. Confirm MySQL is up, disk isn't full, and check whether the VM just rebooted. - If the DB is truly down →
sudo systemctl restart mysql(restart the service, not the server), and make suresystemctl enable mysql. - If the DB is healthy but the app still hangs →
pm2 restart allto reset the connection pool. ⚠️ This is what fixed this incident. - Check app server disk →
df -h. If >85%,pm2 flush+ make surepm2-logrotateis on. - Verify with the curl loop again until everything is 200.
Golden rule: Don't rush to reboot the whole DB server if MySQL is actually healthy — that just causes an outage without fixing anything. Prefer restarting the service, not the server.
The To-Do List for Myself (So It Never Repeats)
An incident being over doesn't mean it's done. Here's what I'm working on so it doesn't happen again:
- DB connection auto-recovery. Shrink
connectTimeout/acquire, lowerretry.max, so the app fails fast (1–2 seconds) instead of hanging for 30. Add connection validation / health-checks so dead connections get dropped immediately. - Global request timeout (e.g. 5–8 seconds → return 503) so no single request can freeze a user for 30 seconds.
- Control VM reboots. Check
/etc/apt/apt.conf.d/50unattended-upgrades. If auto-reboot is on, schedule it to a quiet hour or patch manually. - Permanent log rotation on every node, consistently.
- Monitoring & alerting. This incident was caught by a user report, not an alert — and that's embarrassing. Add an uptime check to MySQL + alerts to Discord/Slack the moment
ECONNREFUSEDshows up.
What I Took Home
If I could only remember a few points from this:
- App idle but requests slow = the problem is in a dependency (DB/Redis/network), not the code.
ttfb=0+ timeout = a hang on the server, usually waiting on a DB connection.- A DB reboot can leave dead connections in the pool →
pm2 restart allto reset. - Restart the SERVICE first, don't reboot the SERVER if the component is actually healthy.
- A small database (1.4GB / 10M rows) is not the problem — don't blame MySQL, don't go swapping databases over an incident like this.
- Logs without rotation = a time bomb that quietly fills the disk.
Point five is the one I most want to hammer home. When you panic, the temptation is always "change the tech, over-optimize everything." But often that's not where the problem is. Sometimes the answer is just: the connections went stale, restart to get fresh ones.
If one of your servers suddenly goes slow while nothing was deployed — check first whether the machine quietly rebooted and the app is still hugging ghost connections. 🚀
The Indonesian version is here.