I Stopped Paying AWS to Watch My Servers and Built My Own Dashboard Instead

A while back I wrote about how I cut my cloud bill from $500 to $50 a month by moving off AWS and onto a few small Hetzner boxes. A bunch of you replied with the same question, and it was a good one:
"Okay, but if you left AWS, how do you even know your servers are alive? You don't have CloudWatch anymore."
Fair point. On AWS, watching your servers is something you just pay for. There's a thing called CloudWatch that collects all your numbers, draws the graphs, and yells at you when something breaks. It works, and you barely have to think about it. But it also shows up on the bill every single month, and the more you watch, the more you pay.
So when I walked away from AWS, I had to answer that exact question for myself: how do I keep an eye on everything without paying someone else to do it?
This is the story of what I built instead. And honestly, it ended up better than what I had before. 😄
What I Actually Needed to See
Before installing anything, I wrote down what I actually care about. Not what's cool, just what I need to know to sleep at night.
It came down to three things:
- Is the server healthy? CPU, memory, disk, network. The boring vitals.
- Is the app working? Not just "is the server on", but "is the app actually serving people without throwing errors".
- When something breaks, do I find out fast? Not tomorrow. Now, on my phone.
That's it. Three questions. Everything I built is just there to answer those three, and nothing more.
The Tools I Used (and What Each One Actually Does)
Here's where people's eyes glaze over, because the names sound scary. They're not. Let me explain each one like a normal person, not a brochure.
- Node Exporter — a tiny program that sits on each server and reads its vitals. CPU, memory, disk, network. That's its only job: measure the machine and hand the numbers to whoever asks.
- Prometheus — the collector. Every few seconds it goes around and asks each Node Exporter "hey, what are your numbers right now?" and writes them down. Think of it as the guy walking the floor with a clipboard, all day, forever.
- Promtail — same idea as Node Exporter, but for logs instead of numbers. It tails the log files on each server and ships every line off somewhere central.
- Loki — where all those logs land. It's like a search engine for your logs. Instead of SSH-ing into a server and squinting at text files, I just type a search and it pulls up exactly what I want across every server at once.
- Prometheus + Loki together = I have the numbers and the logs in one place.
- Grafana — the face of the whole thing. It takes everything Prometheus and Loki collected and turns it into the dashboards and graphs you actually look at. This is the screen I open in the morning with my coffee.
So the flow is simple: little programs on each server measure things, two collectors gather it all up, and Grafana draws the pretty picture. The best part? Every single one of these is free and open source. No per-metric charge, no surprise bill.
And here's a detail I love from the last article: I don't even run this on the production servers. It all lives on my cheap "tinkering" box, the spare one. The production servers just send their data over. So watching everything costs me basically nothing extra.
The Morning Dashboard
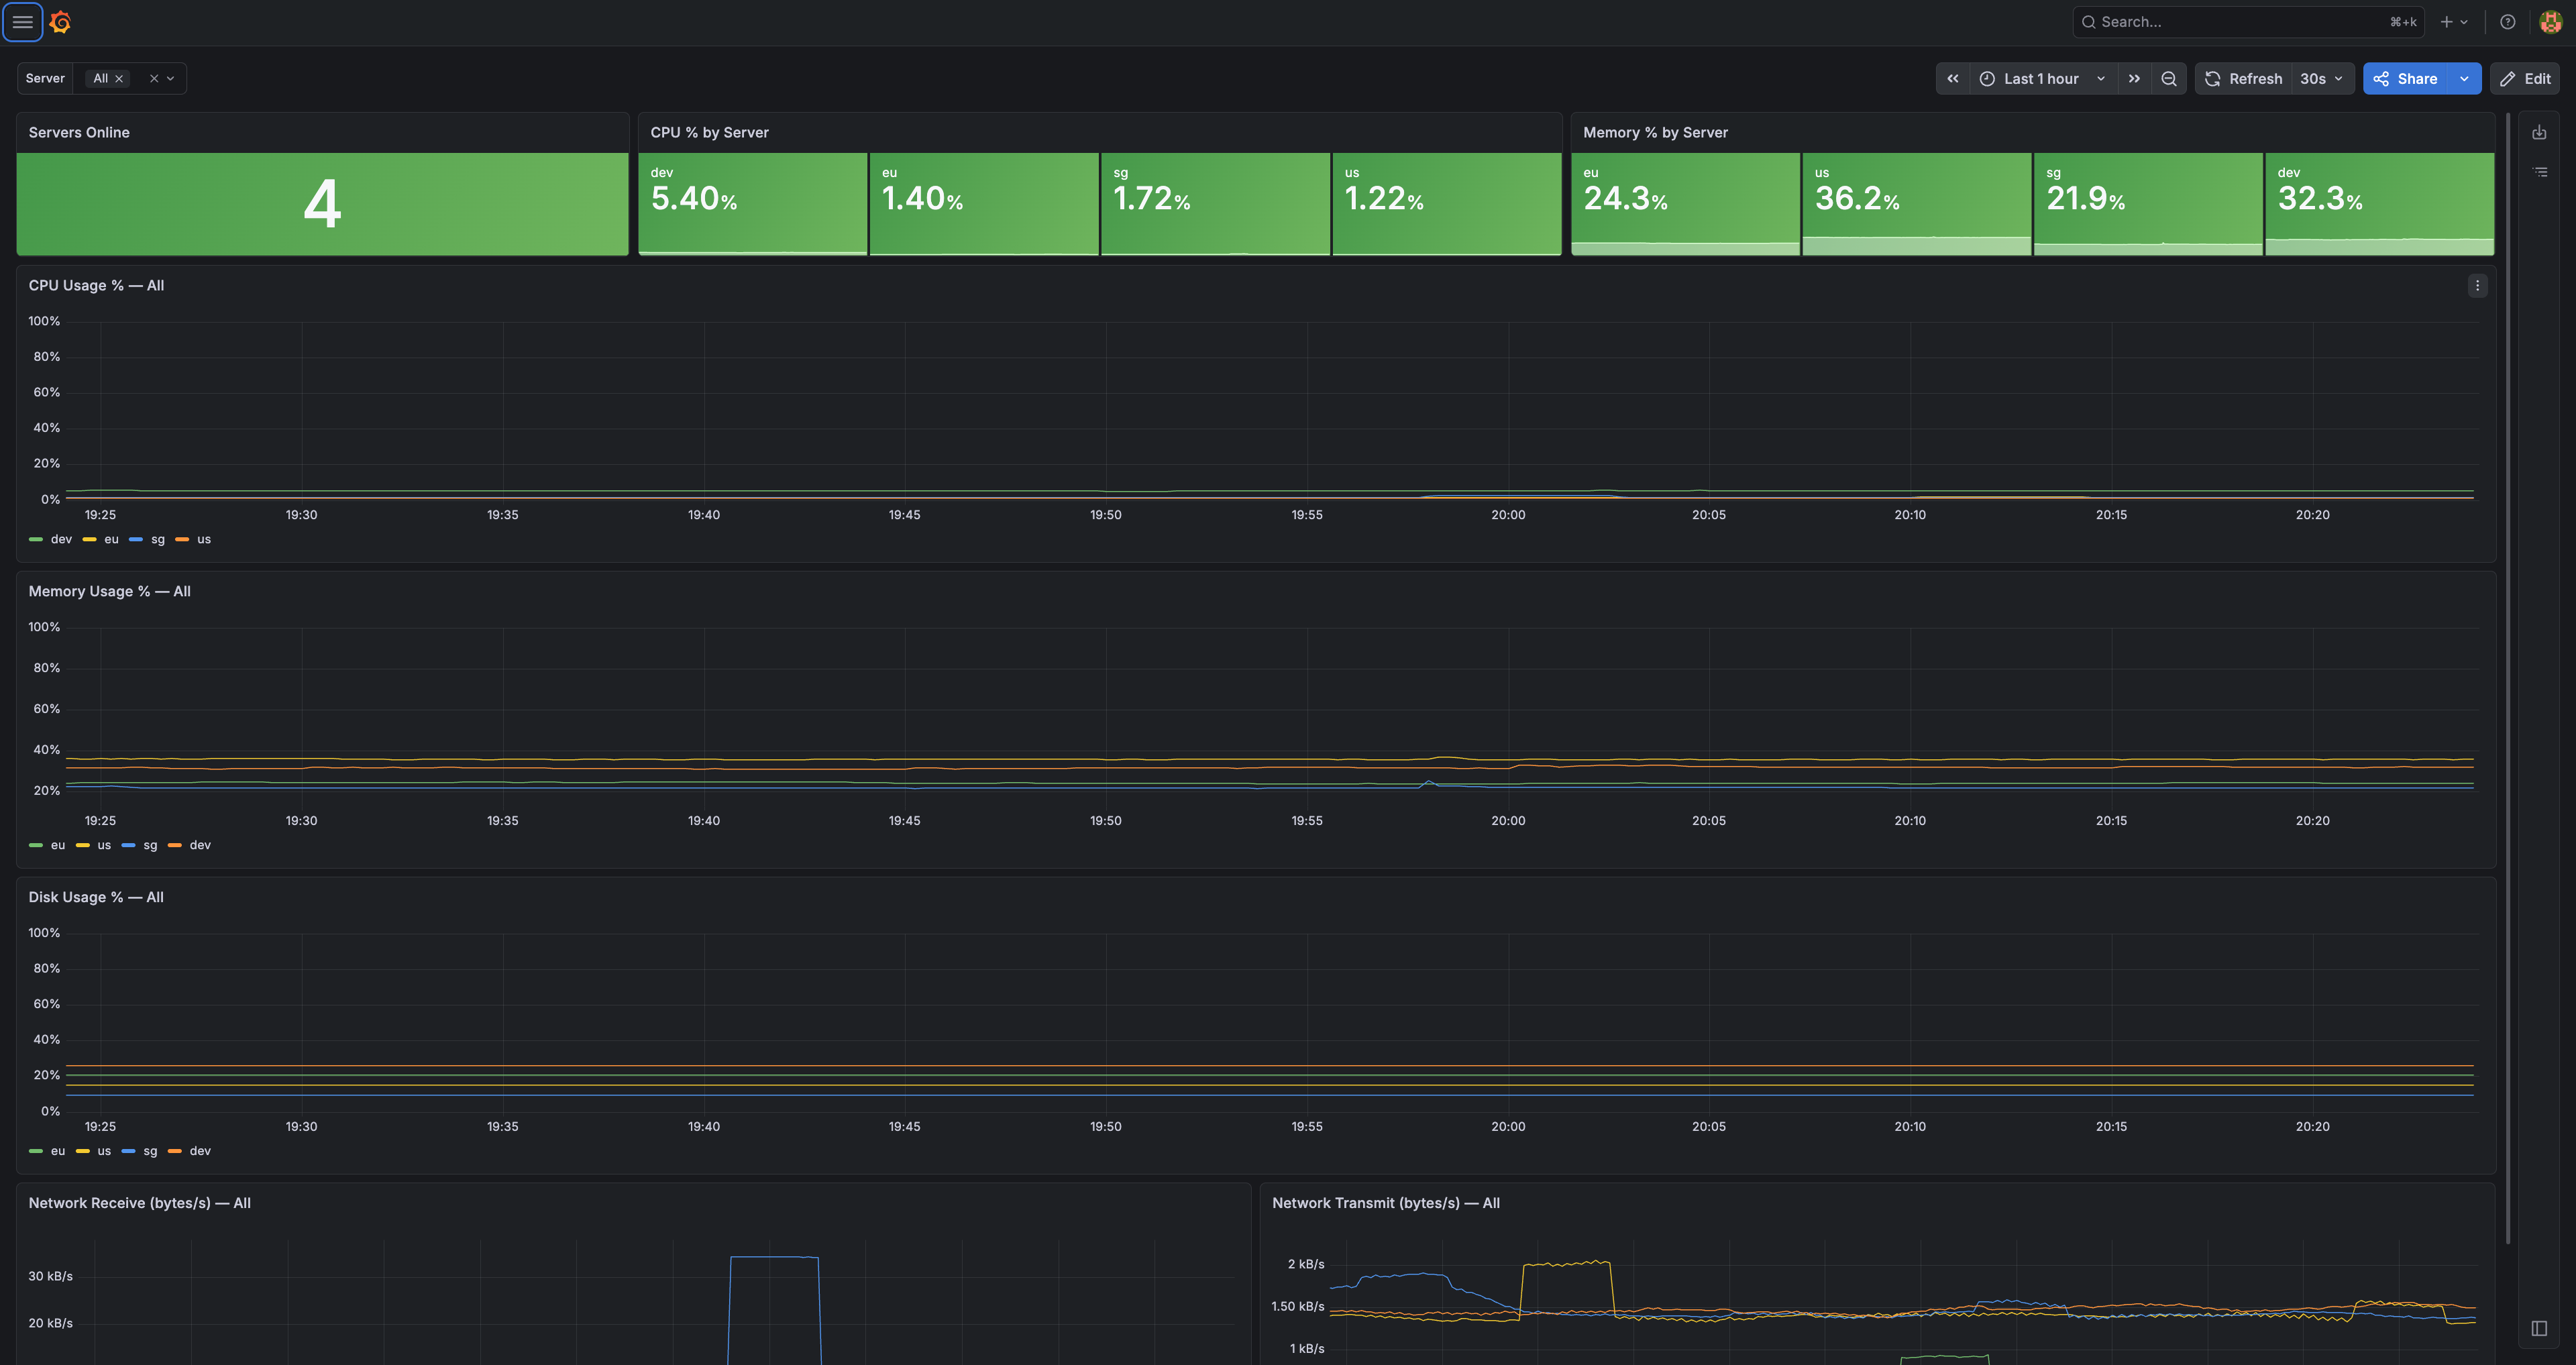
This is the screen I open first thing. One glance and I know if my whole world is okay.

Read it left to right. Servers Online: 4 — all my boxes are up. Then CPU and memory for each region, sitting comfortably low. Below that, the graphs over time for CPU, memory, disk, and network.
The whole point of this screen is that I don't have to read it carefully. If everything's green and the lines are flat and low, I close the tab and get on with my day. The numbers only matter when they stop being boring.
This one screen replaced a big chunk of what CloudWatch used to do for me, and it shows me everything across all my regions at the same time, which CloudWatch always made annoying.
When I Want to Dig Deeper
Sometimes the simple dashboard isn't enough. Maybe the app feels a little slow and I want to know why. That's when I open the detailed view.
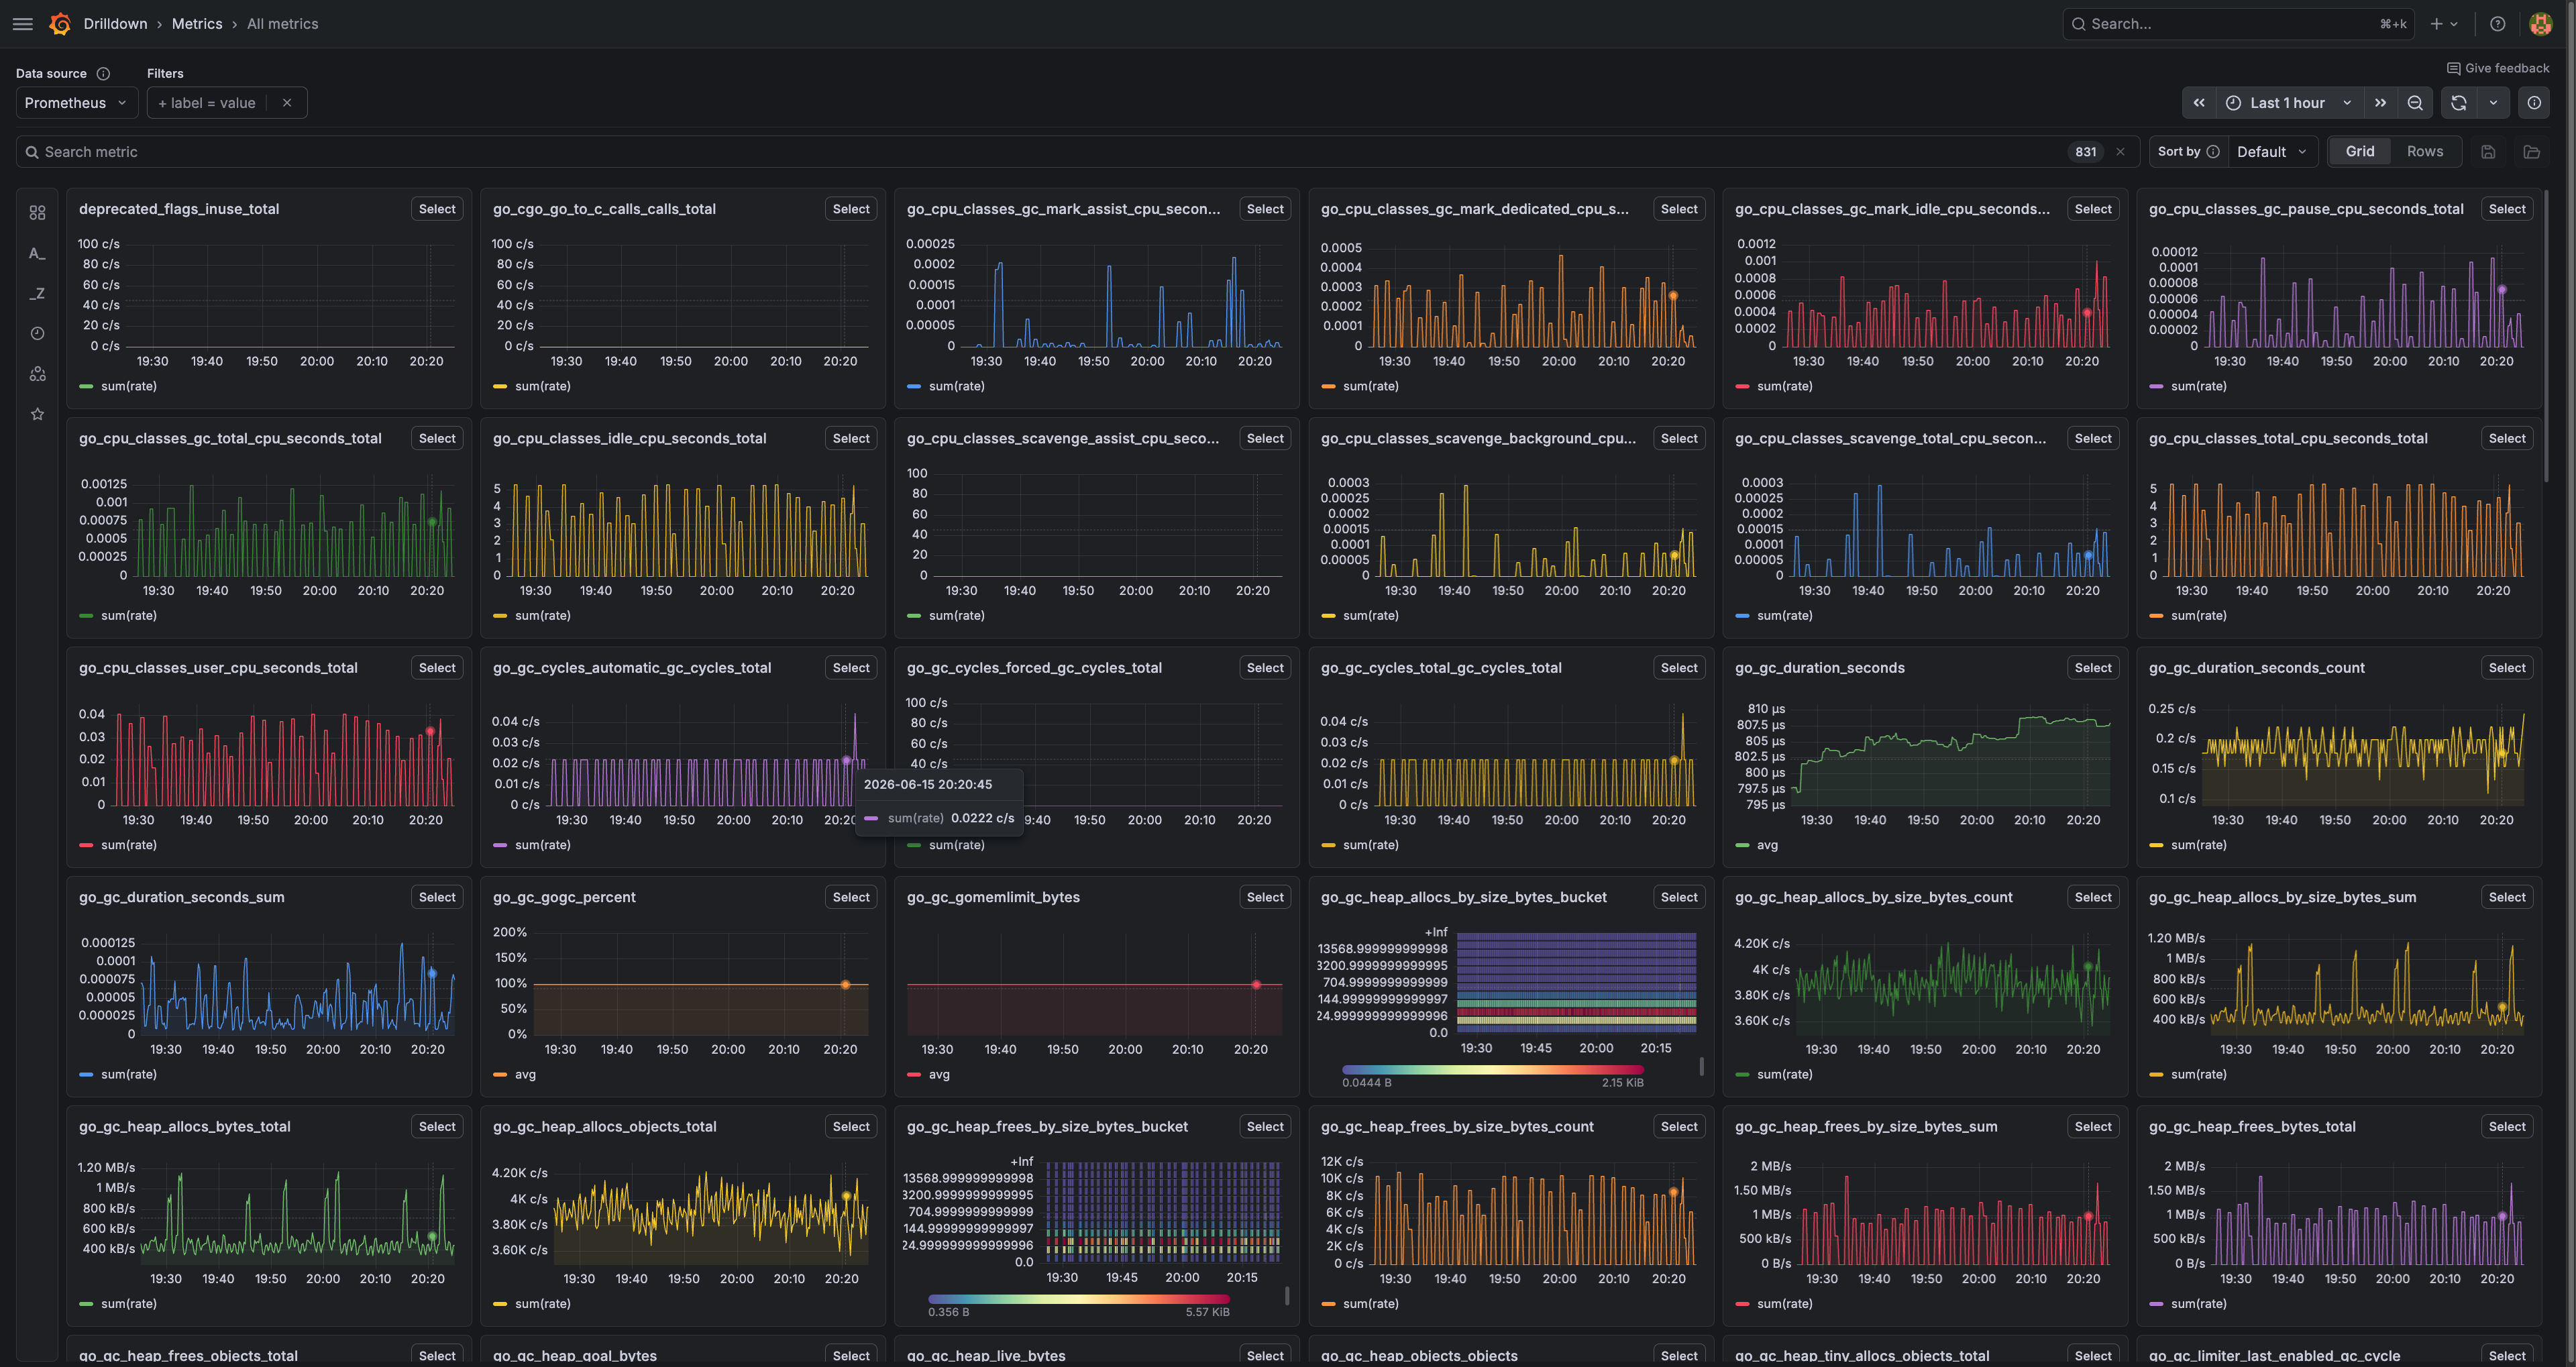
Yeah, it looks like a cockpit. 😅 This is every metric I collect, all on one wall. Garbage collection, memory pools, request counts, the deep internal stuff of the app itself.
I do not look at this every day. Nobody should. This is the "something's weird, let me investigate" screen. When the simple dashboard tells me something is off, this one tells me what. The simple dashboard is the smoke alarm; this is the page I open after the alarm goes off.
The Part That Actually Matters: Getting Yelled At
Here's the thing nobody tells you about dashboards: a dashboard only helps if you're looking at it.
And I'm not looking at it at 3am. I'm asleep. So a pretty dashboard alone is useless for the one moment it matters most, the moment something breaks while I'm not watching.
That's why the real heart of my setup isn't the graphs. It's the alerts.
I set up a handful of simple rules. They're not fancy, and that's on purpose:
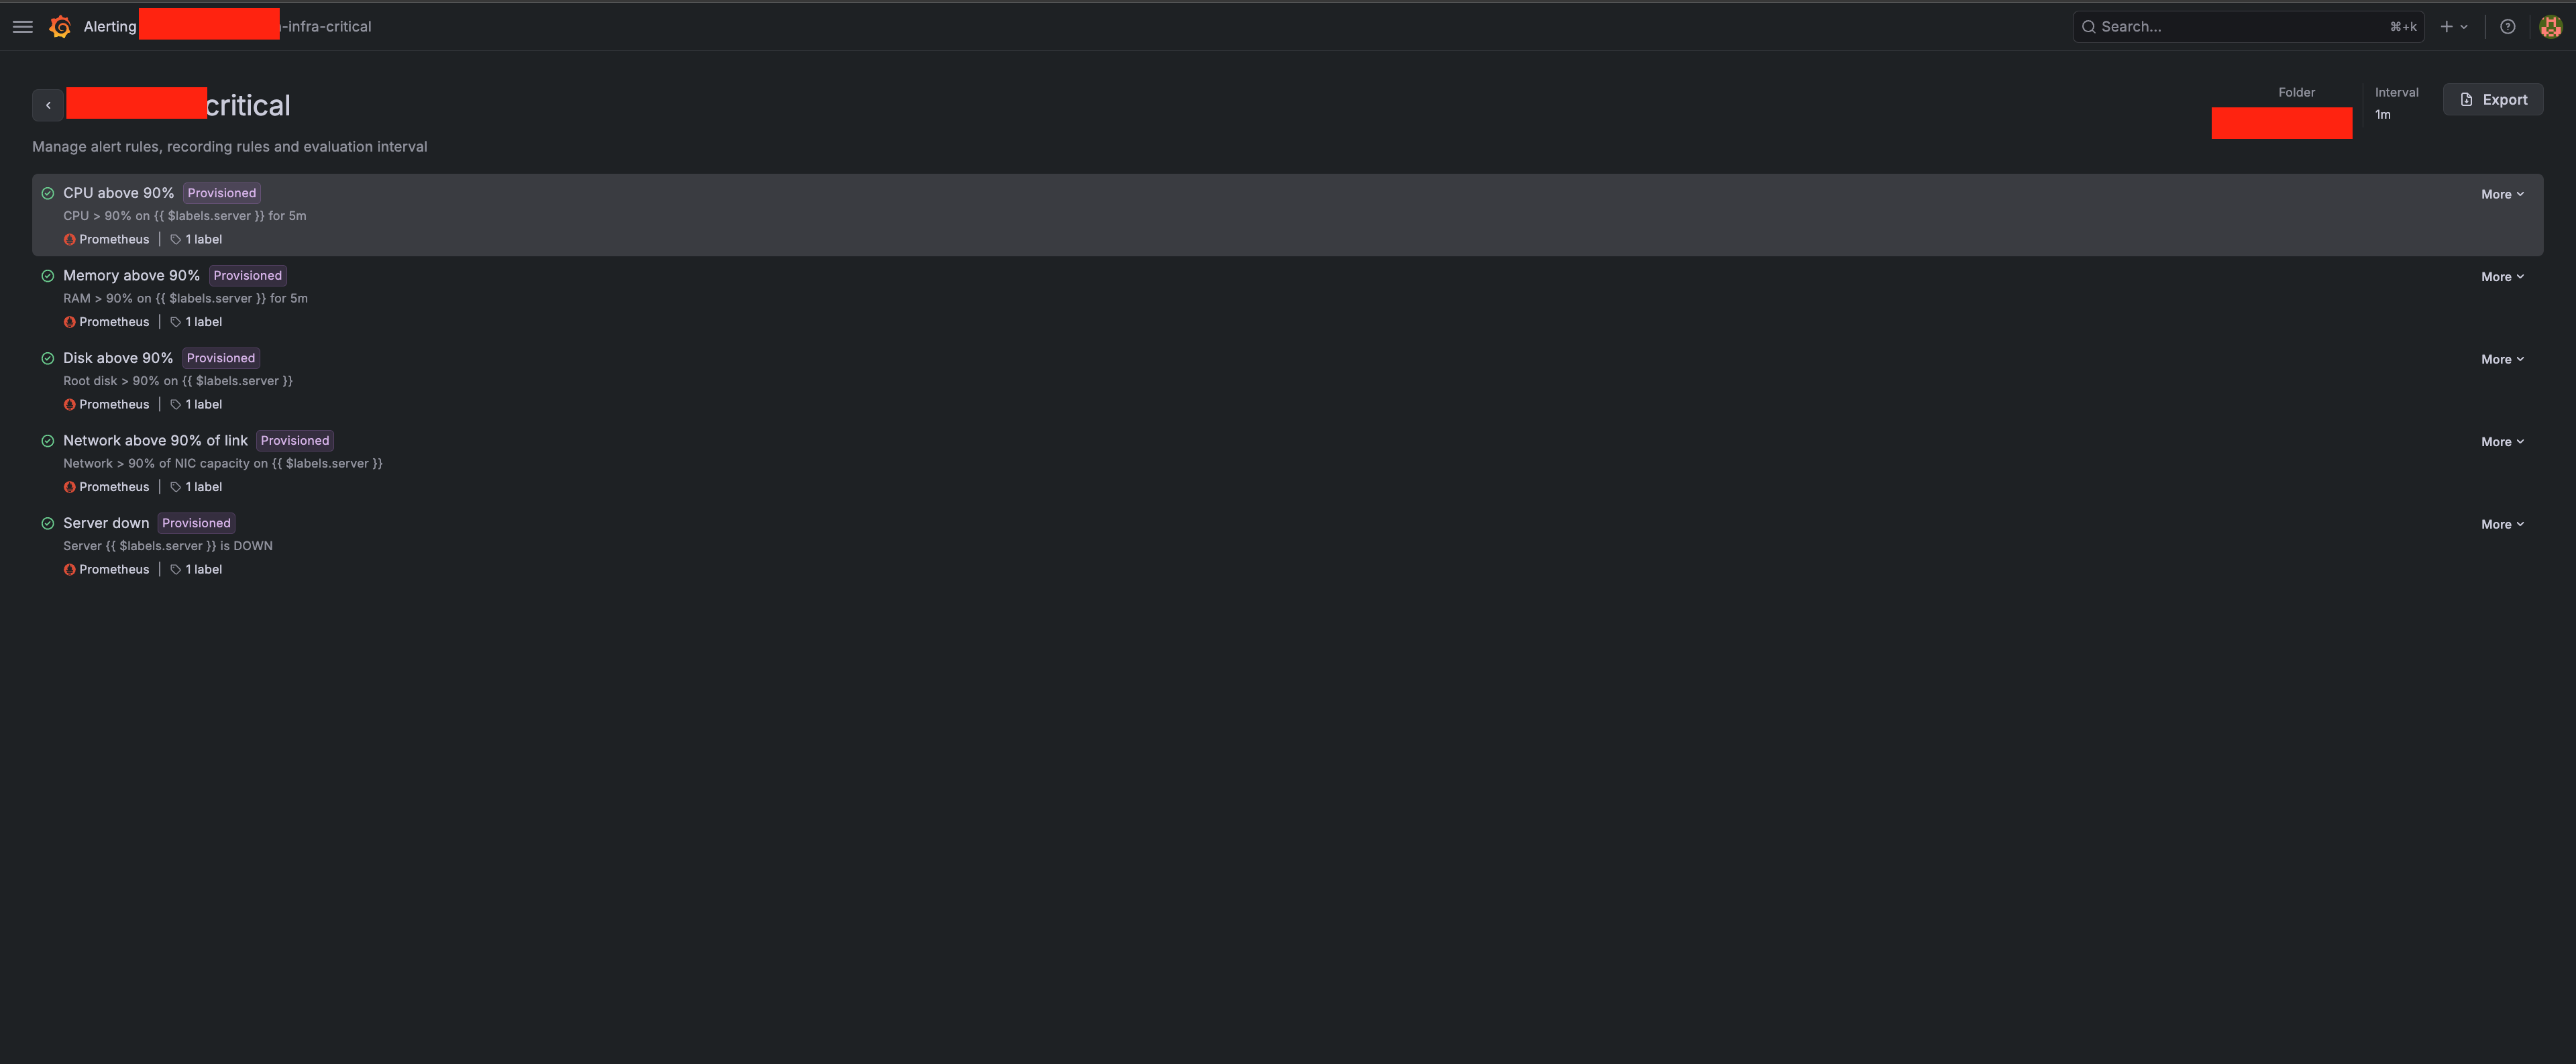
- CPU above 90% for 5 minutes straight
- Memory above 90% for 5 minutes
- Disk above 90%
- Network above 90% of the link
- Server down — the big one. The server stopped answering at all.
Notice the "for 5 minutes" part. I don't want a ping every time CPU spikes for two seconds, that's normal, that's just the server doing its job. I only want to know when something stays bad long enough to actually be a problem. Otherwise you get so many useless alerts that you start ignoring all of them, including the real ones.
And when a rule does trip, the alert comes straight to my chat, on my phone:
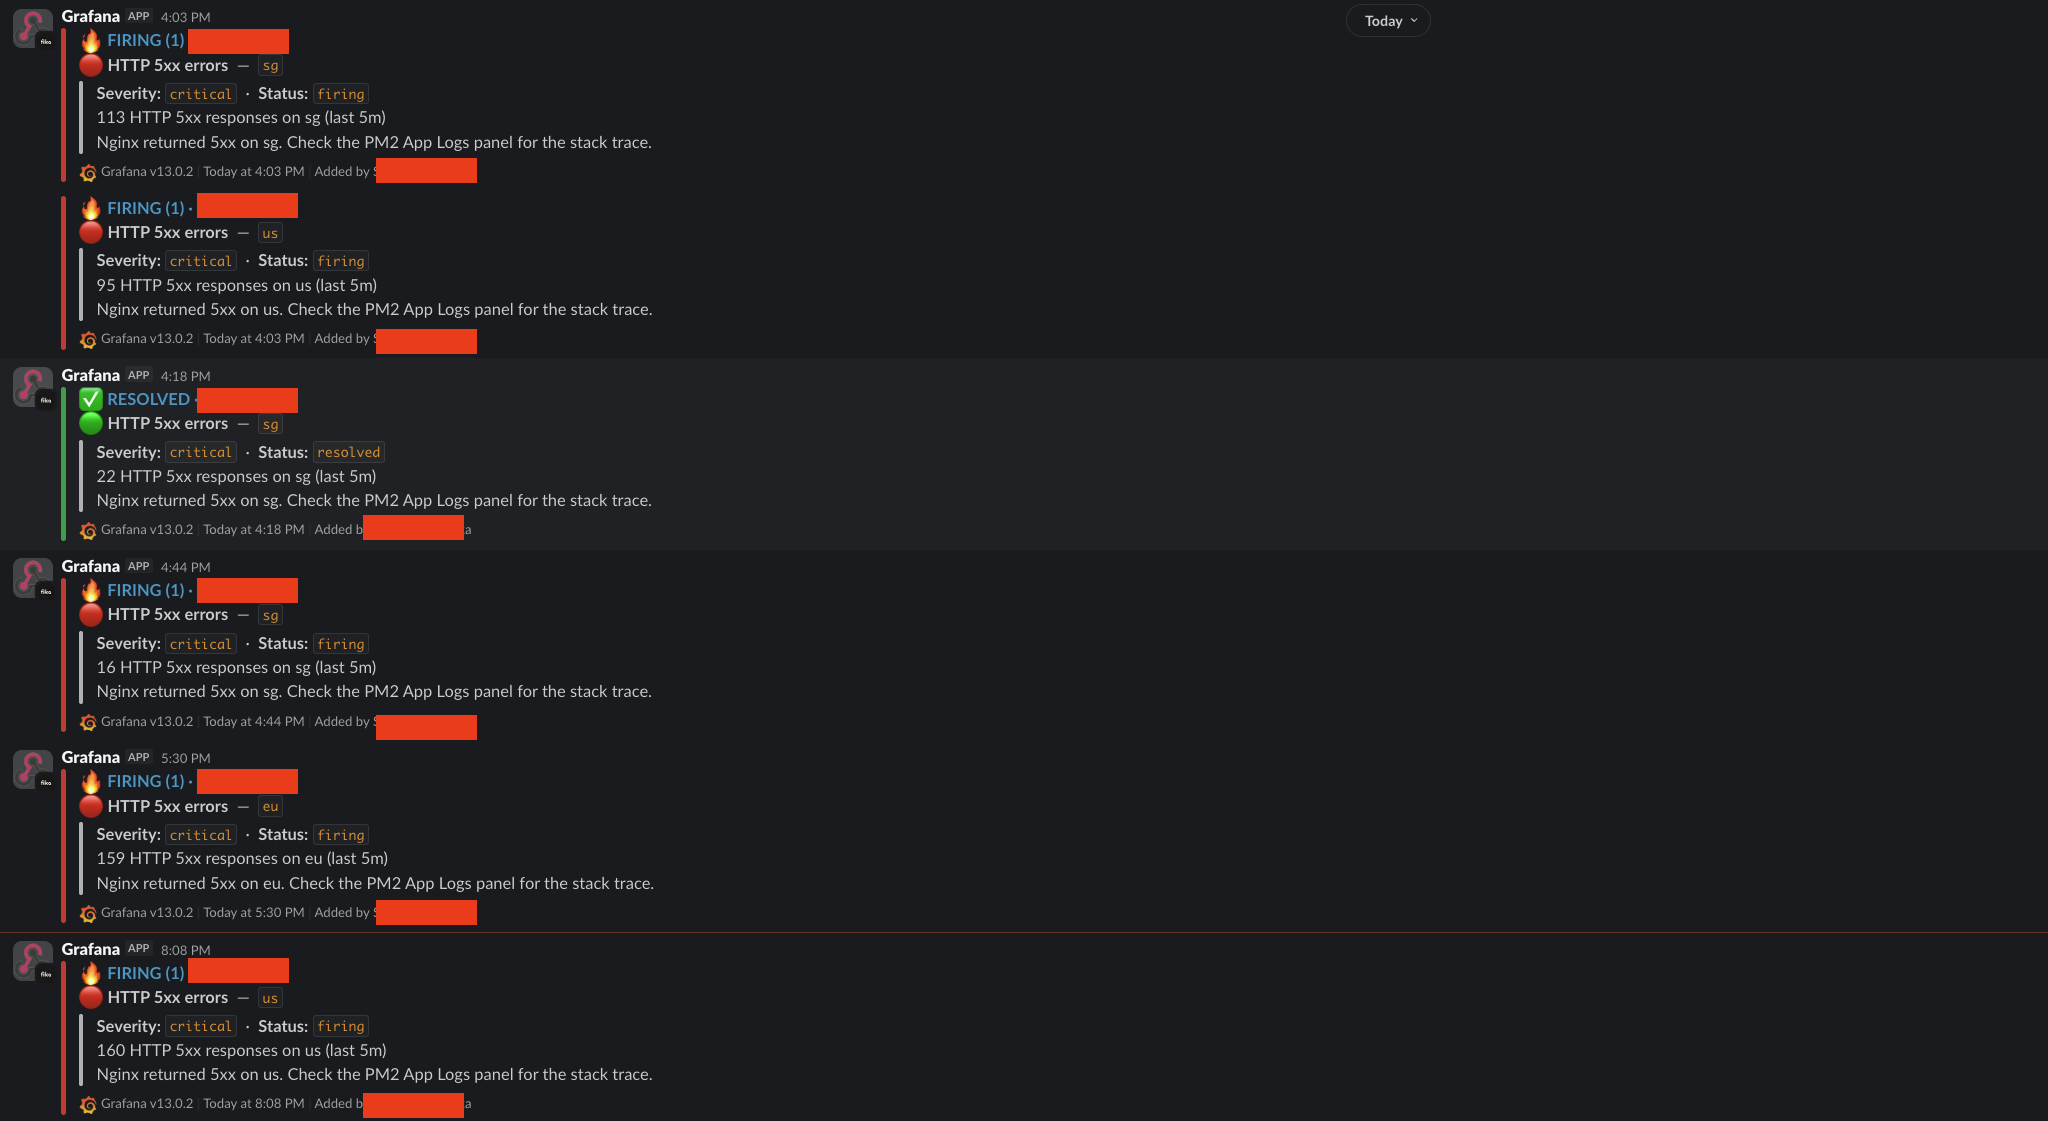
That's a real run where my app started throwing HTTP 5xx errors. Each message tells me which server, what the problem is, and points me at the logs to check. I find out the second it happens, wherever I am, even if I never opened a single dashboard that day.
This is the flip from the last article in action. On AWS, the system watched itself and I paid for the privilege. Now I built the watcher myself, it runs for free, and it taps me on the shoulder the moment something's wrong.
Why I Like This Better Than CloudWatch
I'll be honest, this isn't a "free thing beats paid thing" brag. CloudWatch is genuinely good and it's zero effort. If you're on AWS, just use it.
But for my situation, this setup wins on a few real points:
- It's free. No per-metric cost, no charge that grows as I watch more things. Watching everything costs the same as watching nothing.
- Everything is in one place. All my regions, numbers and logs together, on one screen. CloudWatch always made me jump around.
- I understand it completely. I built every piece, so when something's weird with the monitoring itself, I know exactly where to look. No black box.
- It's not tied to AWS. If I move providers again tomorrow, my whole monitoring setup comes with me, unchanged. It doesn't care where the servers live.
That last one is the quiet winner. My monitoring isn't married to any cloud. It's mine.
The Real Lesson, Same as Last Time
If you read the last article, you know where this is going.
The expensive, fully-managed way wasn't wrong. When I had a million users and a boss who didn't care about cost, paying AWS to watch everything was exactly right. I'd do it again.
But the moment my situation changed, the right answer changed too. I went from "let AWS watch it for me" to "I'll watch it myself", and just like with the servers, the reward wasn't only the saved money. It was finally understanding my own system, top to bottom.
There's no black box anymore. When something breaks, I don't open a support ticket and wait. I open my own dashboard, read my own logs, and fix it. That feeling is worth more than the dollars I saved.
If you want me to go deeper on any piece, the exact Prometheus config, how I wired up the alerts to chat, or the Grafana dashboards themselves, just say the word. I'm happy to write the full step-by-step as a follow-up.
Now go check on your own servers. And maybe ask yourself: do you actually know they're okay right now, or are you just hoping? 🚀